Telemetry
Introduction
With the telemetry feature in the Inetlab.SMPP library, you can easily gain valuable insights into your SMPP applications. By enabling telemetry and exporting spans to a collector, you can effortlessly monitor and analyze the behavior and performance of your application. This feature allows you to identify issues, optimize performance, and integrate with popular monitoring tools like Azure Application Insights or OpenTelemetry. This article will provide you with a step-by-step guide on configuring your project and utilizing the telemetry feature effectively, enabling you to make informed decisions and deliver high-performance SMPP applications.
Prerequisites
To use the telemetry feature in the Inetlab.SMPP library, ensure you have at least version 2.9.28 installed and that your application targets .NET 6.0 or later. Additionally, set up a telemetry collector or monitoring tool like Jaeger, Azure Application Insights or OpenTelemetry to receive exported spans.
Configuration
To enable telemetry and export spans to a telemetry collector like Jaeger, follow these steps:
- Install Jaeger
Begin by installing Jaeger in your environment. You can find installation instructions specific to your platform on the Jaeger website (https://www.jaegertracing.io).
- Install the necessary packages:
 dotnet add package OpenTelemetry.Exporter.OpenTelemetryProtocol
 dotnet add package OpenTelemetry.Extensions.Hosting
- Configure the telemetry provider:
    // Configure spans exporter to OLTP collector.
    services.AddOpenTelemetry()
        .WithTracing(b =>
        {
            b.ConfigureResource(r => r.AddService("MyApp", "1.0"));
            b.AddSource("Inetlab.SMPP");
            b.AddOtlpExporter();
        });
Jaegger accepts OpenTelemetry Protocol (OLTP) on port 4317 (gRPC) and 4318 (HTTP)
Monitoring and Analysis
Jaeger is a popular distributed tracing system that provides powerful monitoring and analysis capabilities for your SMPP applications. Follow these steps to monitor and analyze telemetry data:
- Start your SMPP application:
With the Jaeger exporter configured, start your SMPP application. It will now generate and export spans to Jaeger.
- Access the Jaeger UI:
Open your web browser and navigate to the Jaeger UI. The default URL is usually http://localhost:16686. You should see the Jaeger UI dashboard.
Analyze telemetry data:
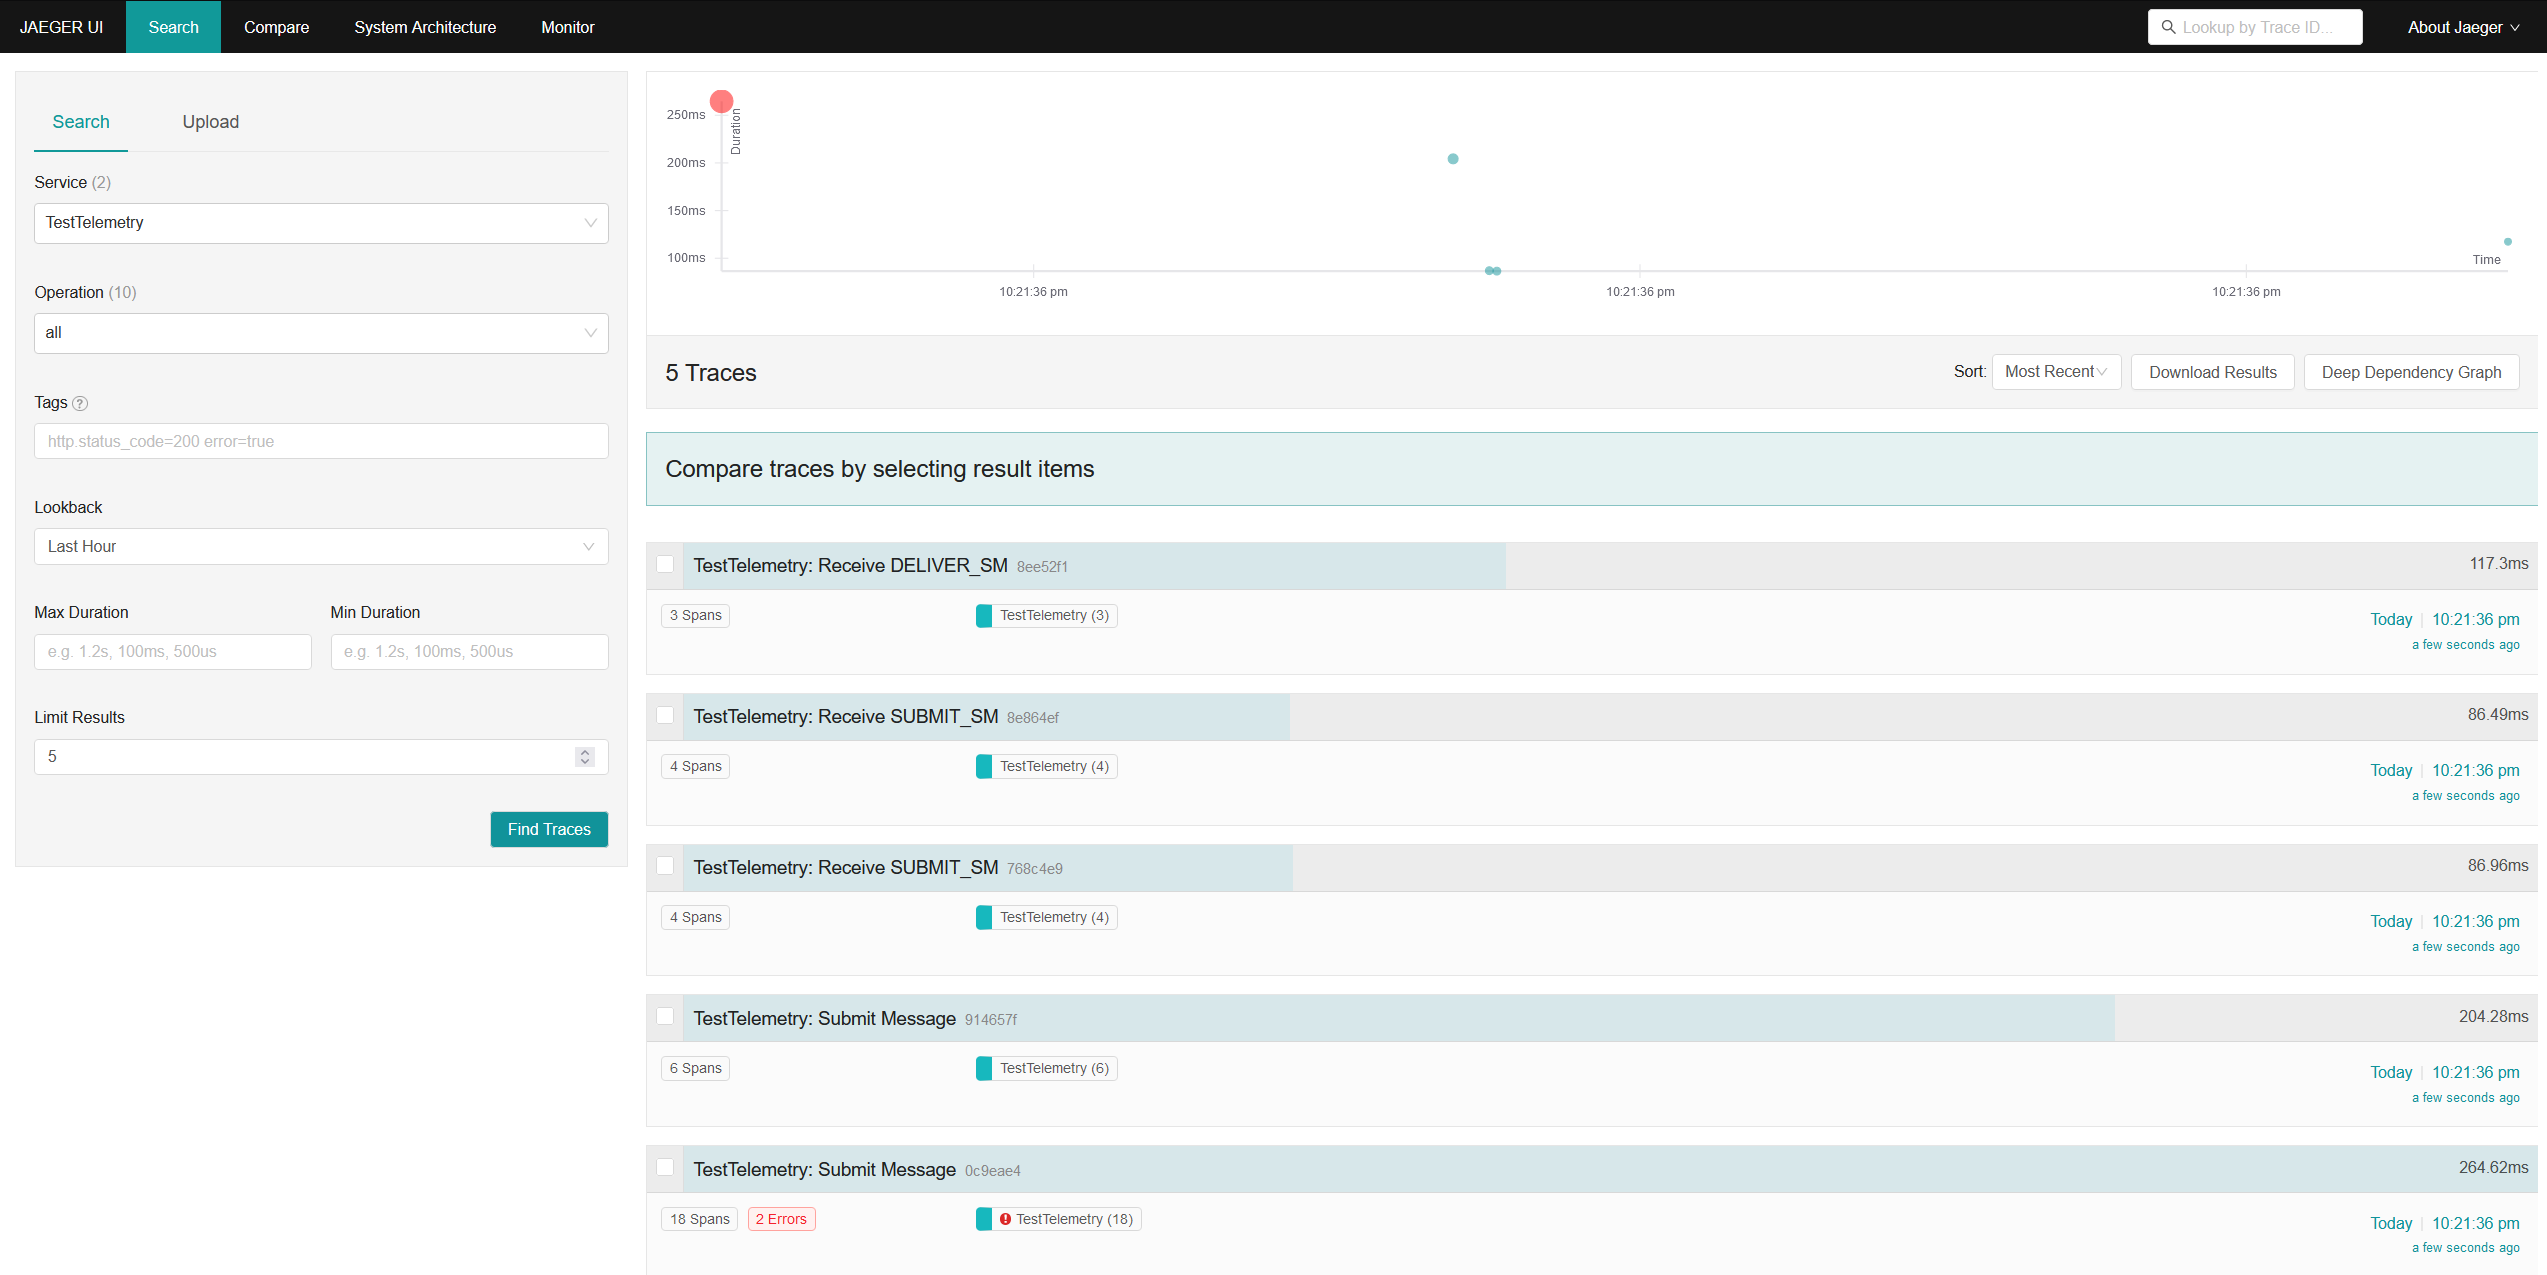
In the Jaeger UI, you can analyze the telemetry data captured from your SMPP application.
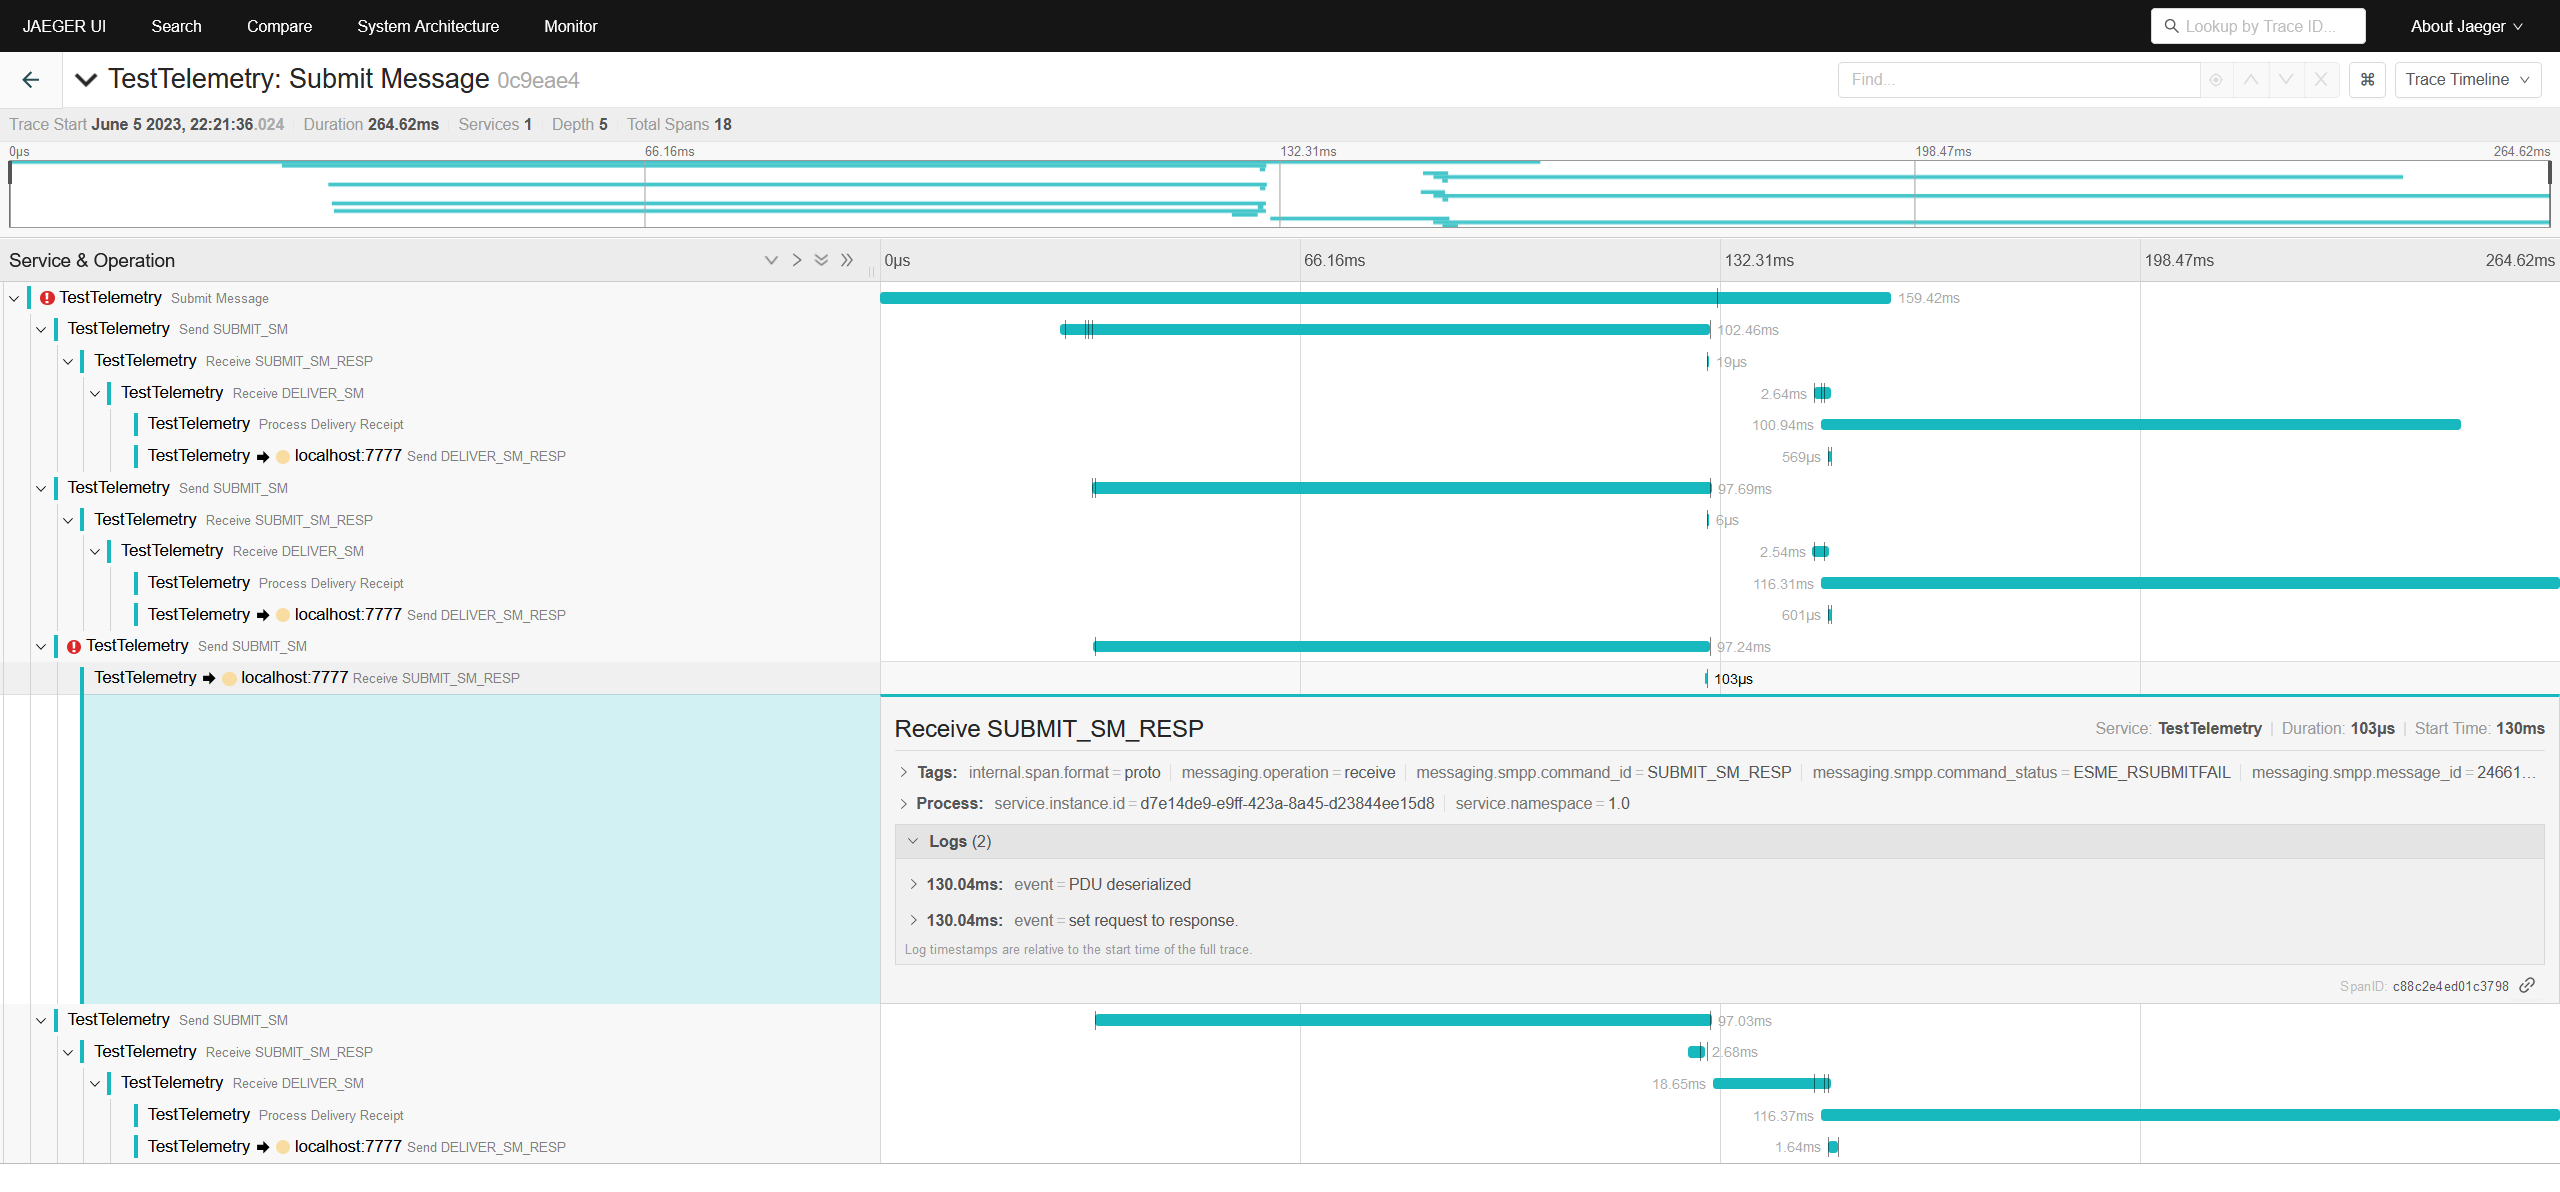
The trace view showcases a concatenated message with four SUBMIT_SM PDUs. In the trace, the third PDU is received with an ESME_RSUBMITFAIL status, indicating a submission failure. The trace view also displays the timely response from the SMSC, with SUBMIT_SM_RESP messages sent within approximately 100ms for each SUBMIT_SM command. Additionally, the trace reveals the relationship between the delivery receipts and each corresponding SUBMIT_SM, providing valuable insights into the message delivery process and its associated responses.
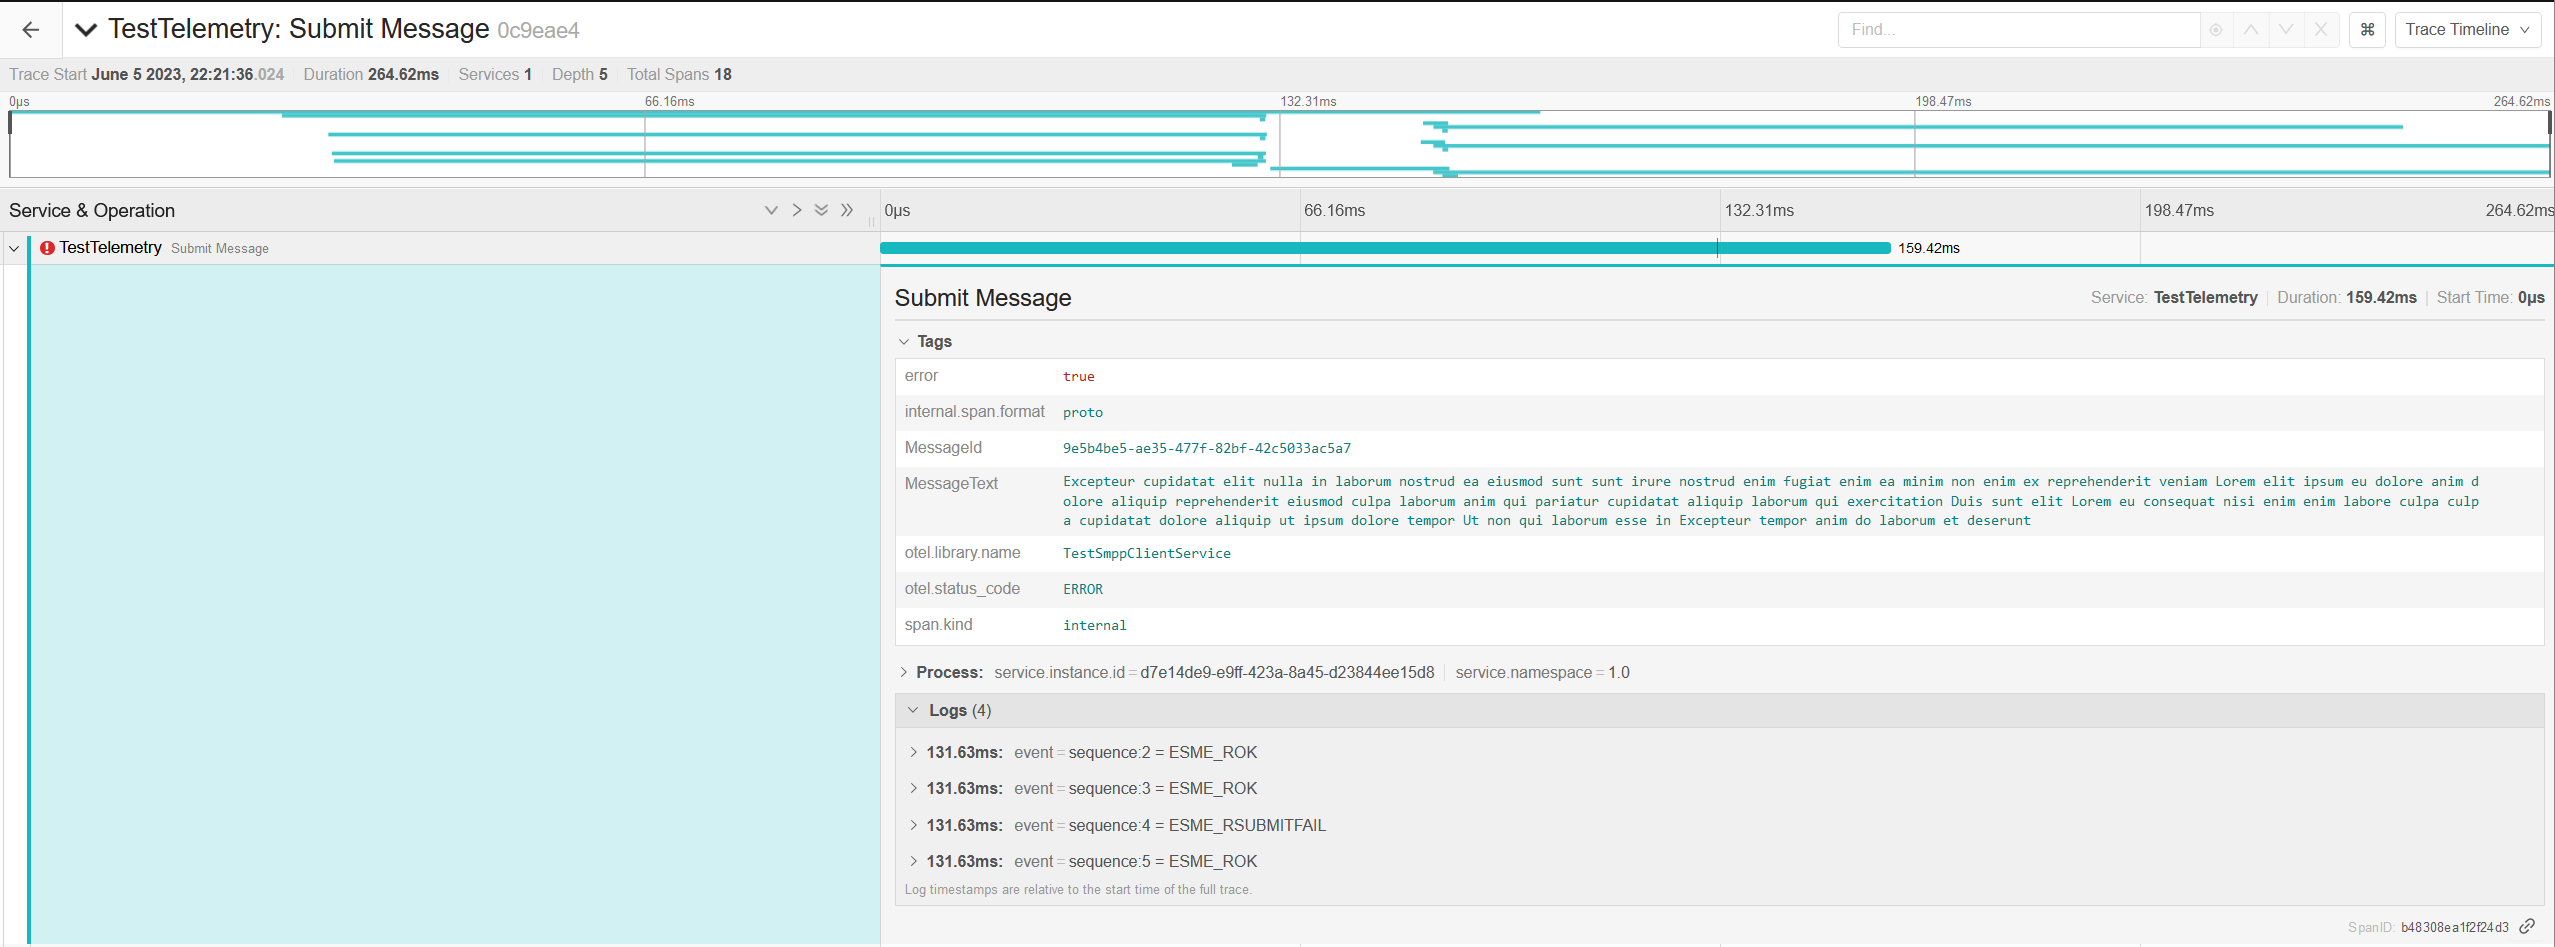
In the following screenshot, you can observe the activity generated by the TestTelemetry application. It provides detailed information, including the original message text and corresponding message ID. This allows you to easily track and identify specific messages within the telemetry data.
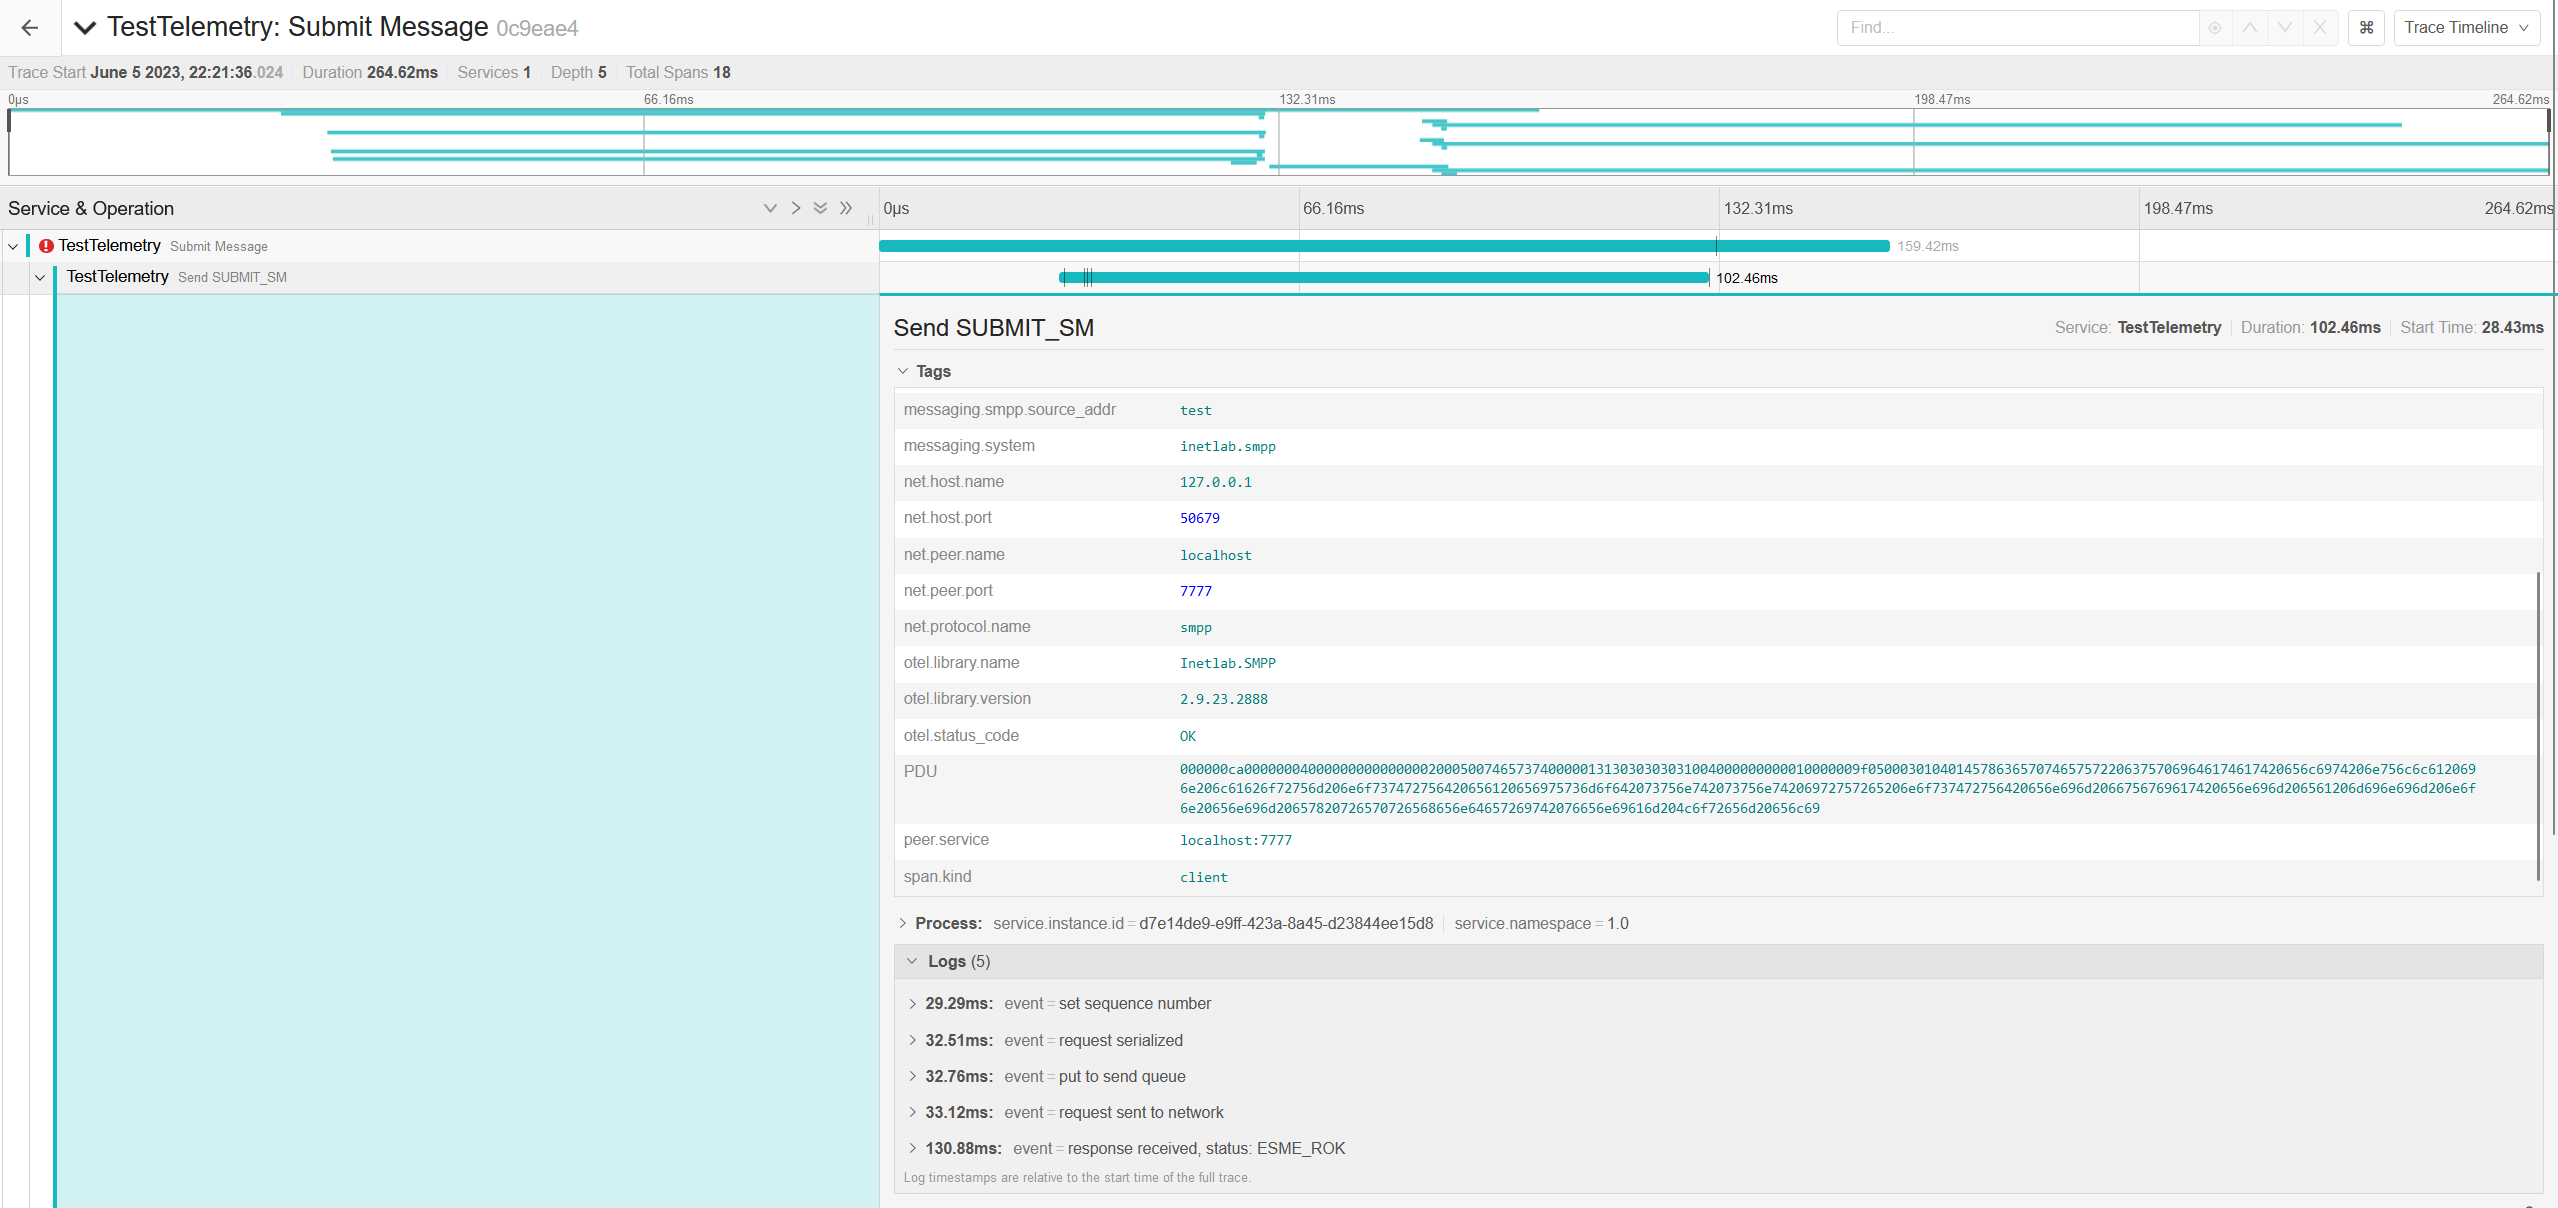
The screenshot displays the activity generated by the library, which includes tags with essential fields extracted from the SUBMIT_SM PDU. Moreover, it provides the actual byte array that was sent to the network, giving you visibility into the raw data. Additionally, the activity captures timing events for each step involved in sending the SUBMIT_SM PDU, allowing you to analyze the duration of each operation and identify any potential bottlenecks or performance issues.
Conclusion
In conclusion, the telemetry feature in the Inetlab.SMPP library provides .NET developers with valuable insights to monitor and optimize their SMPP applications. By configuring the project to export telemetry data, developers can gain a deeper understanding of their application's behavior and performance. This allows for effective issue identification and performance enhancements.
We value your feedback and suggestions. If you have any suggestions or questions, please feel free to reach out to us through the contact us form. We appreciate your input and are dedicated to continuously improving our library to meet your needs.